Air Pollution Comparator
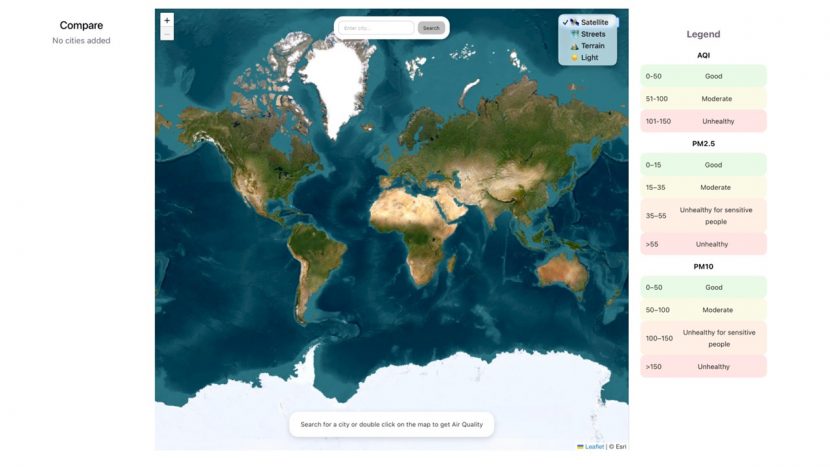
The Air Pollution Comparator is a web application designed to visualize and compare air quality data for different cities and locations. The […]
@ UAS Technikum Wien

The Air Pollution Comparator is a web application designed to visualize and compare air quality data for different cities and locations. The […]
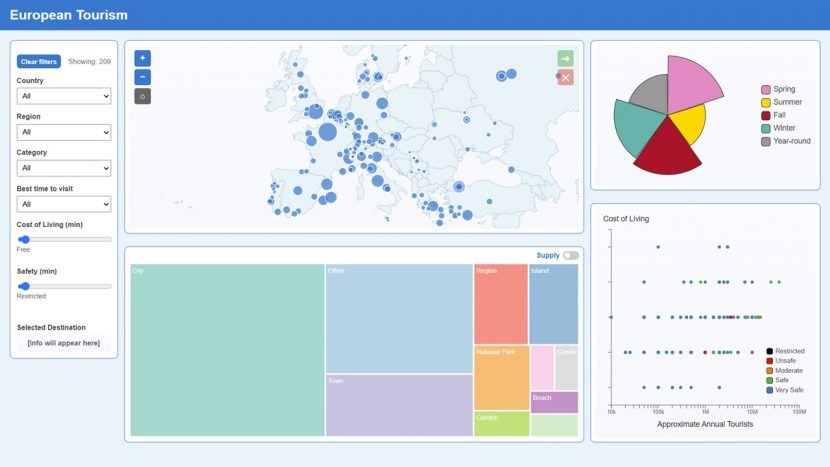
The European Tourism Dashboard is an interactive, browser-based data visualization dashboard built with D3.js (v7). It lets users explore 209 European tourist […]
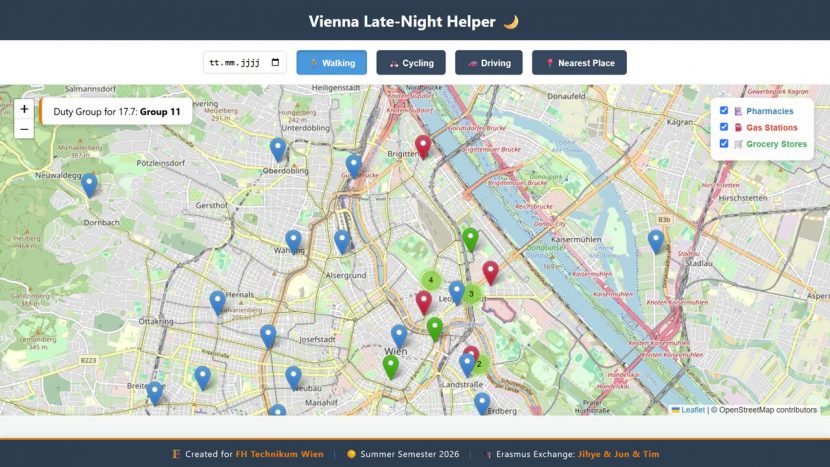
Vienna Late-Night Helper is a web application designed to help people find essential services during late-night hours in Vienna. The goal was […]
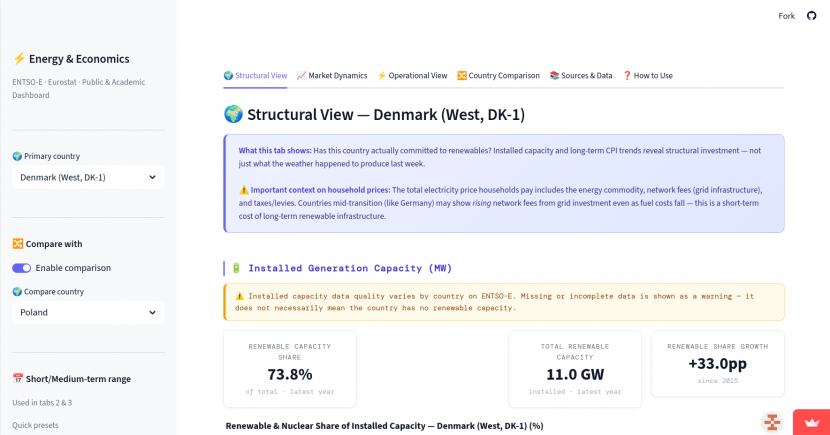
The Energy & Economics Dashboard connects two worlds that are usually studied separately: a country’s electricity mix and its economic stability. Drawing […]
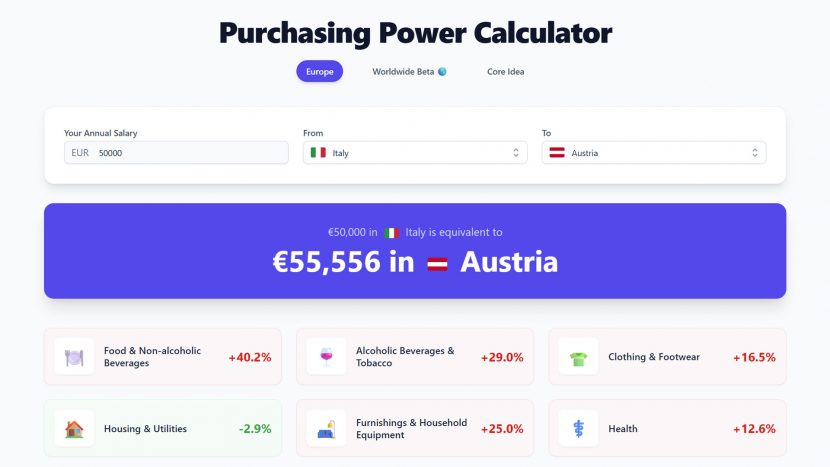
In Austria and across Europe, professionals are increasingly mobile. The single market has made moving for work easier than ever, creating a […]
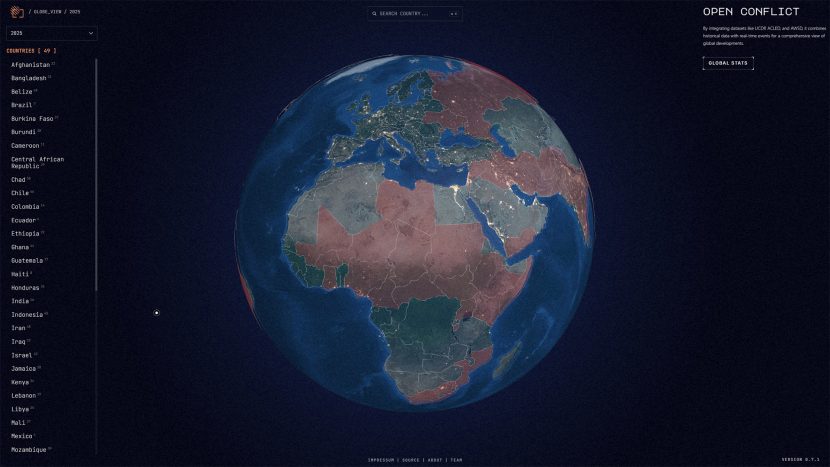
By integrating established datasets such as Uppsala Conflict Data Program (UCDP), Armed Conflict Location & Event Data Project (ACLED), and Armed Violence […]
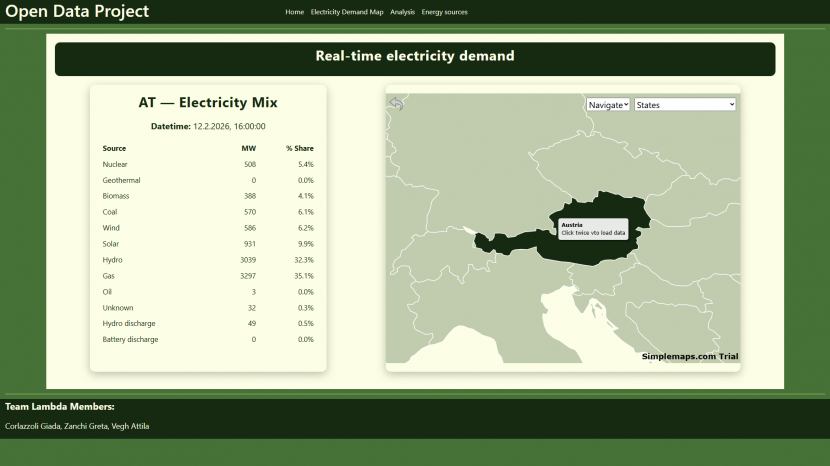
The transition toward a sustainable, secure, and climate-neutral energy system is one of the most pressing challenges facing Europe today. As countries […]
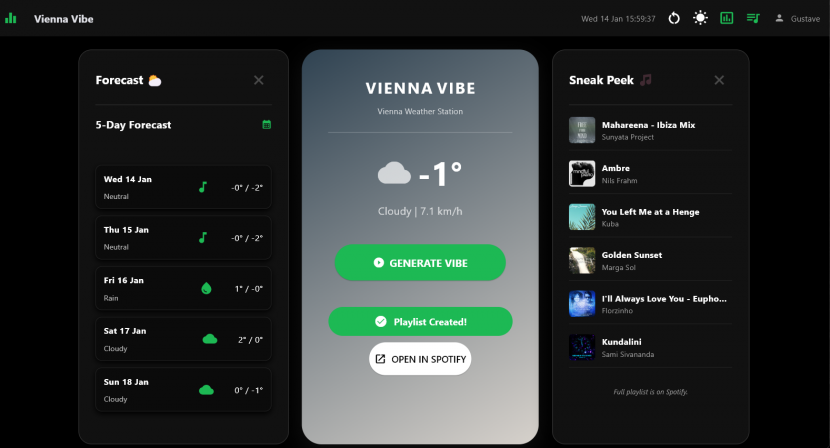
Music isn’t just a form of entertainment – it also has a measurable impact on our feelings and mood. Research in psychology […]
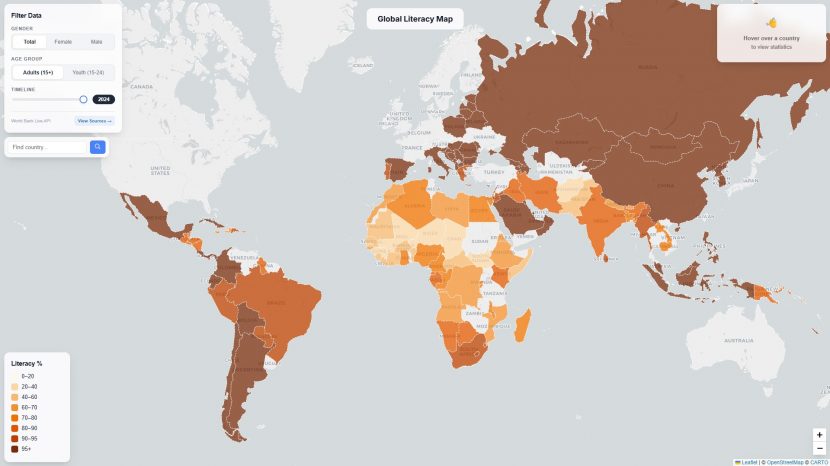
Global literacy varies widely across regions due to differences in access to education, economic development, gender equality, and government investment. Visualizing literacy […]
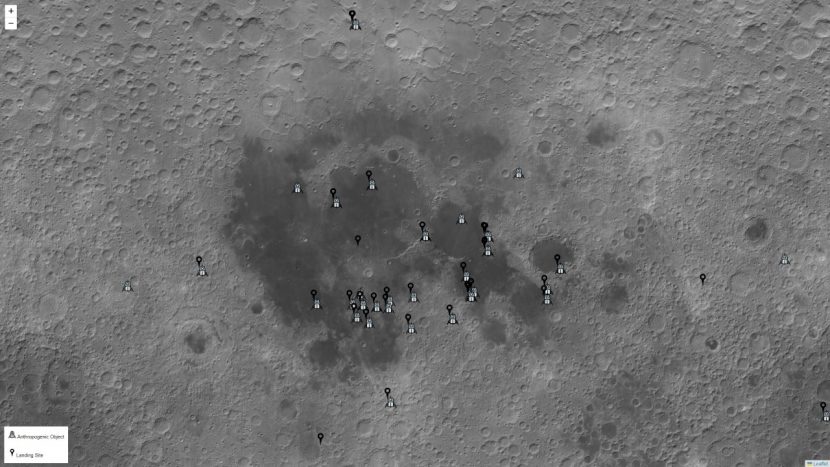
A lot of us as children dream to be astronauts and wonder what it would be like to travel in a spaceship. […]