
This project was developed during a course on data ethics and open data at the University of Applied Sciences Technikum Wien. Starting from a discussion about environment and economic growth, the aim of this project is to give an idea of the relationship between environmental pollution and economic growth.
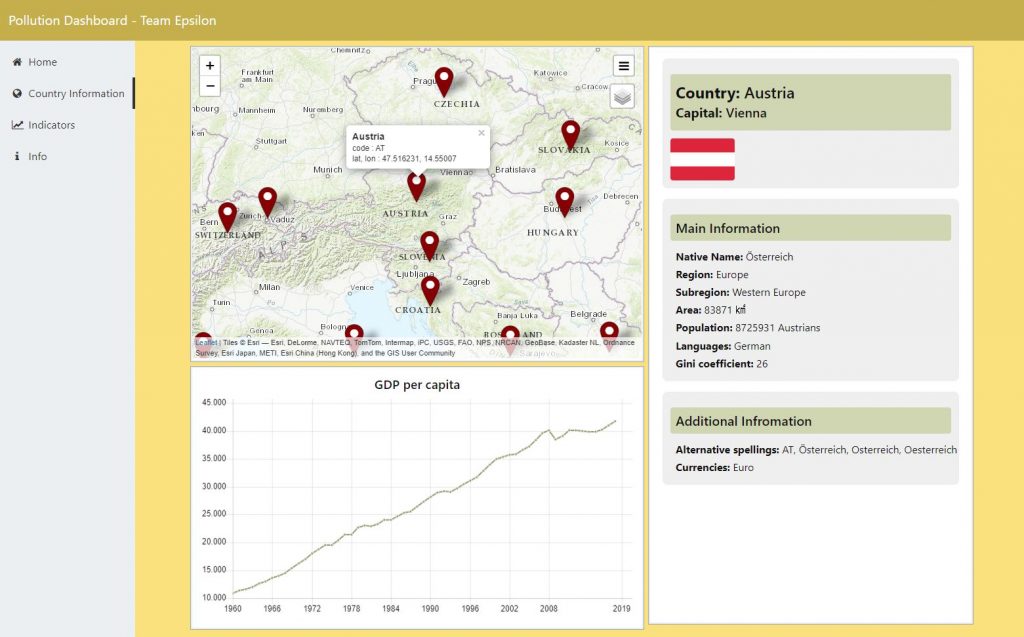
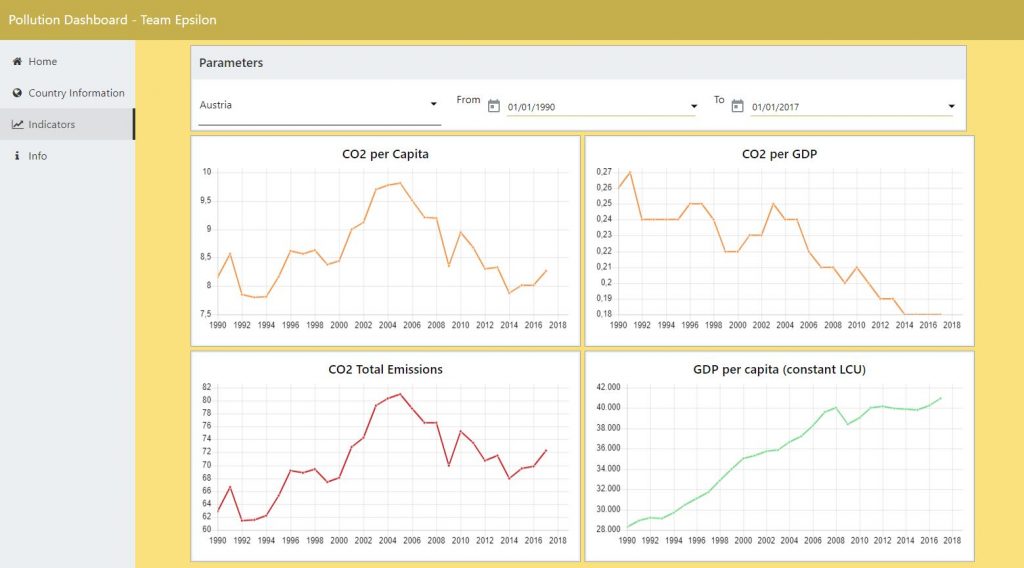
The main idea of this project was to provide a map which shows the rise and fall of pollution levels relative to the rise and fall of the economy. With the three team members originating from different countries (Austria, Russia, and Bulgaria) the project team wanted to have an international perspective.
This project has been realized by the students Edith Stifter, Maya Ivanova and Oleg Vitols in June 2020 as part of the course Data Ethics and Open Data at the UAS Technikum Wien. This course is part of the project IoCEST – Internationalisation of the Curricula in Engineering, Environmental, Smart Cities and Sport Technologies which has been funded by the City of Vienna.
References
The World Bank: “World Bank Official Boundaries” [WWW Document]. URL https://datacatalog.worldbank.org/dataset/world-bank-official-boundaries (accessed Jun. 29, 2020).
The World Bank: “GDP per capita (current US$) | Data.” [WWW Document]. URL https://data.worldbank.org/indicator/NY.GDP.PCAP.CD (accessed Jun. 29, 2020).
“REST COUNTRIES” [WWW Document]. URL https://restcountries.eu/ (accessed Jun. 29, 2020).
European Commission: “Fossil CO2 emissions of all world countries, 2018 report” [WWW Document]. URL https://edgar.jrc.ec.europa.eu/overview.php?v=booklet2018&dst=CO2emi (accessed Jun. 29, 2020).